Vacancy Rate Is a Lagging Indicator. Here's What to Watch Instead.
By the time your vacancy rate tells you there's a problem, the problem is already months old.
5 min read
By Rob Howie, Founder & CEO · Senzo · April 2026
Key Takeaways
- Vacancy rate measures a gap that has already opened — often weeks or months before it appears in a report
- Net FTE flow, outflow rate trends, and absence pattern changes are leading indicators that precede vacancy rate movement
- Proactive workforce management requires continuous monitoring at the unit and provider type level
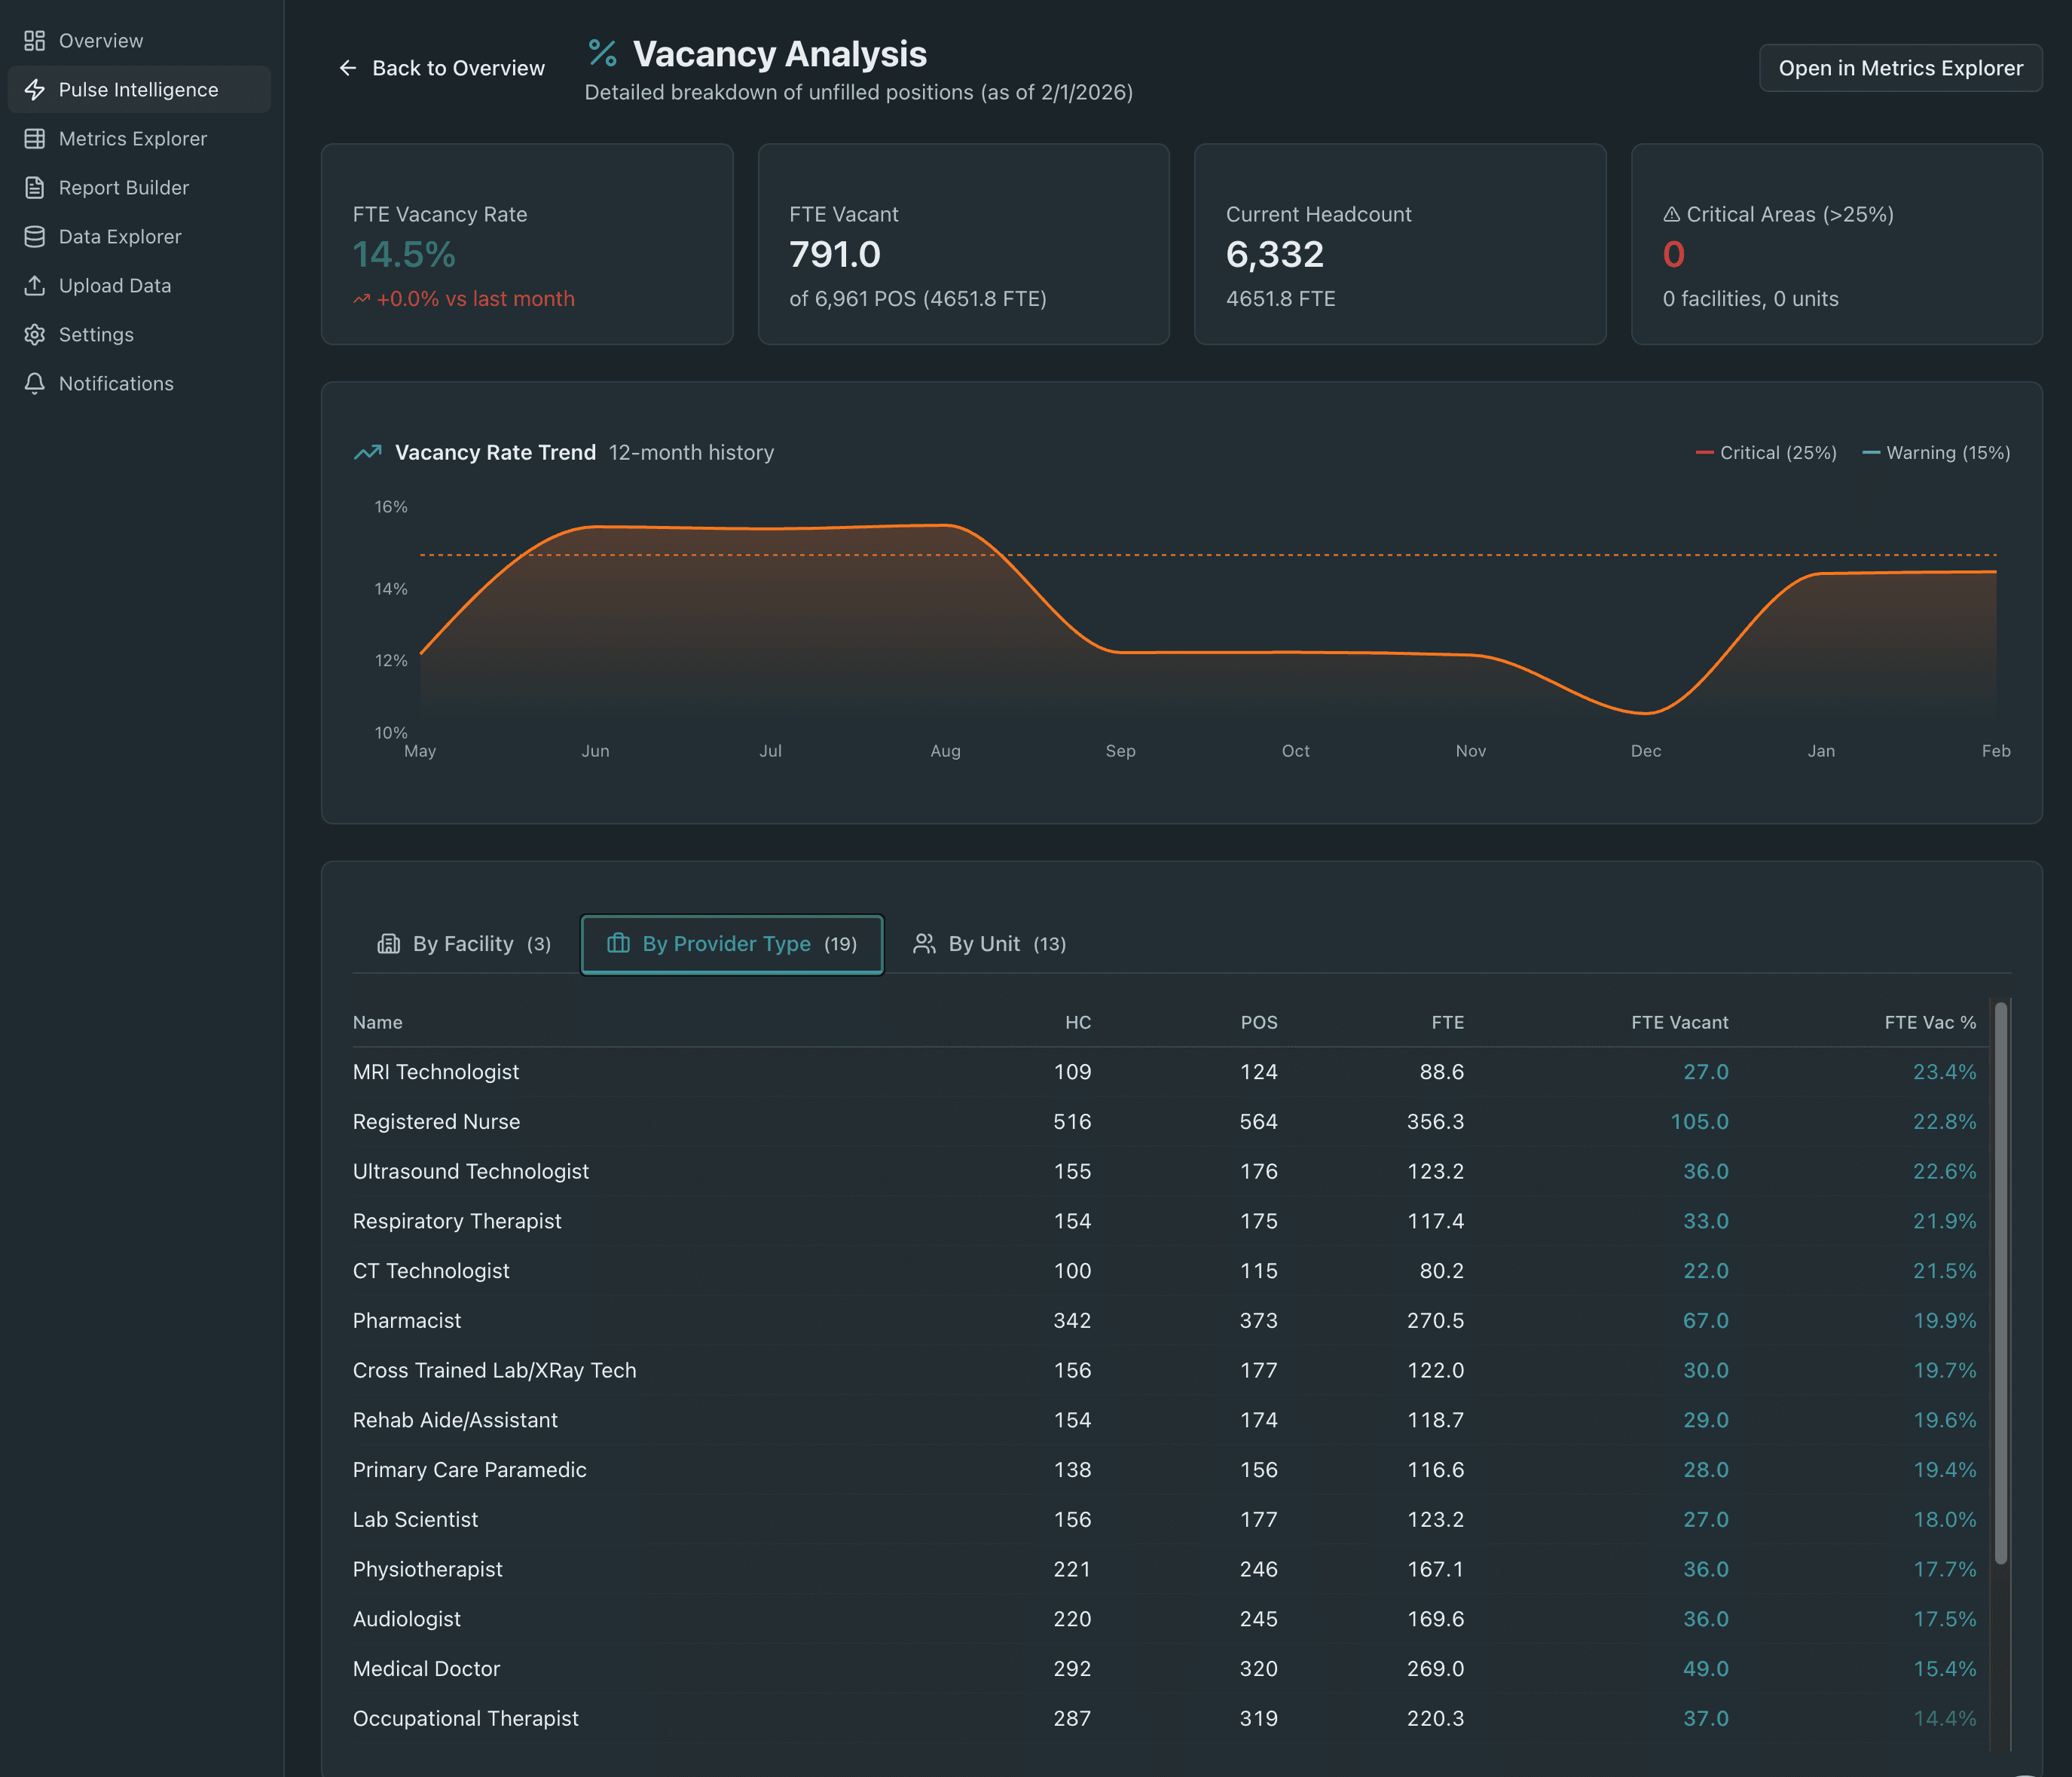
Vacancy rate is the most commonly tracked workforce metric in healthcare. It is reported in board packages, benchmarked against industry averages, and used to drive recruitment targets. It is also, by definition, a lagging indicator - a measure of a gap that has already opened, often long before it appears in a report.
This does not make vacancy rate useless. It is a meaningful measure of workforce state. But organizations that treat it as their primary signal for workforce risk are consistently discovering problems after the window for proactive intervention has closed.
Understanding why requires looking at what vacancy rate actually measures - and what it doesn't.
What vacancy rate tells you
Vacancy rate is a point-in-time snapshot of unfilled positions as a percentage of total authorized positions. It tells you the current gap between what you have and what you are budgeted for. That is genuinely useful information for resource planning, recruitment prioritization, and financial forecasting.
What it does not tell you is how the gap got there, how long it has been building, whether it is getting better or worse, or what is driving it. A unit with a 14% vacancy rate could be recovering from a turnover spike six months ago, or it could be in the early stages of an attrition pattern that will push vacancy to 22% by the end of the fiscal year. The number looks the same in both cases.
The indicators that precede vacancy
Meaningful workforce intelligence requires tracking the signals that lead vacancy rate, not just vacancy rate itself.
Net FTE flow. The difference between inflow and outflow FTE on a rolling basis is one of the earliest indicators of an emerging vacancy problem. A unit or specialty where outflow consistently exceeds inflow will see vacancy rate rise - but the divergence in flow typically appears weeks before vacancy rate moves materially. Monitoring net FTE flow gives organizations time to intervene before the gap opens rather than after.
Outflow rate trend. A rising outflow rate - even from a baseline that looks healthy - is a meaningful early signal. Staff don't typically leave all at once. Turnover acceleration builds gradually, often visible in the data weeks before it registers as a vacancy problem. An outflow rate trending upward over three consecutive months in a specific unit or provider type warrants investigation regardless of what current vacancy rate shows.
Absence pattern changes. Sustained increases in unplanned absence rates are consistently correlated with workforce stress and impending attrition. Staff who are disengaged, burned out, or actively job-searching show up in absence data before they show up in turnover data. An absence rate that has trended upward for 60–90 days in a specific unit is a leading indicator worth acting on.
Overtime concentration. As discussed elsewhere, overtime clustering is both a cost driver and a workforce health signal. Units running sustained high overtime are under structural staffing pressure - either because vacancy has already opened, or because conditions are being created that will drive vacancy. Tracking overtime at the unit level on a continuous basis surfaces this pressure early.
Building a leading indicator framework
The shift from lagging to leading workforce monitoring is not complicated in principle. It requires tracking a small set of metrics - net flow, outflow trend, absence patterns, overtime concentration - at the unit and provider type level, on a continuous basis, with enough historical context to distinguish signal from noise.
What makes it difficult in practice is the data infrastructure required to do it well. These metrics live in different source systems. Assembling them manually at the frequency and granularity required for leading-indicator monitoring is not operationally feasible for most workforce teams. By the time the data is assembled, the window has already moved.
The organizations that are beginning to manage workforce risk proactively are the ones that have closed this infrastructure gap - replacing manual data assembly with continuous, automated intelligence that surfaces leading indicators in real time, at the level of granularity where intervention is actually possible.
Vacancy rate will always be part of workforce reporting. But the health systems that are managing their workforces most effectively are the ones that stopped treating it as the headline.